

Command.
It’s a term in baseball that some people have trouble defining, and yet everyone knows it when they see it.
Everyone knows that this is what elite fastball command looks like. Just like everyone knows that this is what elite breaking ball command looks like.
It’s different from control; control is simply the ability to throw strikes. A decent indication of a pitcher’s control can be found in his BB%. It isn’t perfect but it gets the job done.
Command is, more or less, putting the ball where you want. All strikes are considered equal in the box score, but a strike right down the middle and a strike on the edge are not equal in-game. One pitch – the one down the middle, in this case – is likely easier to hit, and more often than not, that pitch right down the middle was not where the pitcher intended it to go. The ability to pick and choose your spots smartly and with consistency – that’s command. It’s often considered a subcategory of control itself.
That “pitch intention” – that is, where the pitcher intends for the ball to go – is a huge part of the reason that baseball and sabermetricians and front offices may never have a firm grasp on quantifying command. Unlike many other baseball stats today, there is an inherent human aspect that is impossible to eliminate.
In May of 2018, Eno Sarris of the Athletic tried his hand at quantifying command with a stat in which he dubbed Command+. It’s a fantastic article, idea, and metric that I absolutely recommend that you read. Command+ attempts to quantify pitcher intent using the pitch type and where ideally that pitch should be according to historical uses, an idea developed by Kyle Cunningham-Roads, Greg Gifford and Adam Whitehouse at STATS.
Yet, while we know that command is a combination of intent and location together, and the methodology in determining intent in Command+ is sound, perhaps we’re better off ignoring something remarkably hard, maybe even borderline impossible to quantify such as intent. So that’s what I will be doing – focusing on pitch location and ignoring the “intent” altogether, to produce a Location Runs Prevented (LRP) for each pitcher. Let’s see what kind of results are generated.
How It Works
Each pitch crosses the plate at a certain point, and now with the help of StatCast, we can measure the X and Y of these locations better than ever. Baseball Savant has broken them down in what the minds at Baseball Savant at called “Attack Zones”, which are compartmentalized as shown below:
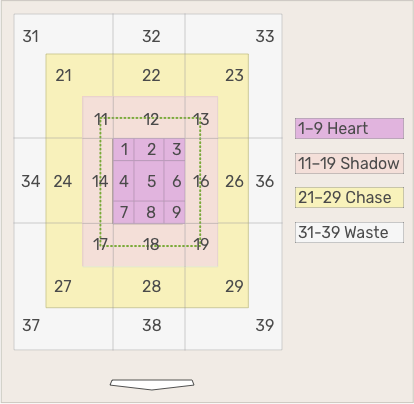
All 39 zones have their own number, but they can also be grouped into 4 major groups that are defined by the batter’s strike zone – the heart, shadow, chase, and waste zones.
Depending on the count, some attack zones are “better”, or more preferable than others. Most pitchers are likely going to aim for the shadow zone (aka the edge of the strike zone) a majority of the time, and maybe the Chase zone when ahead in the count. However, we know that pitchers miss their spots quite frequently and there are quantifiable differences between pitches in different zones.
LRP sets out to quantify these differences in every single pitch by analyzing 3 major components – the count, the attack zone, and the pitch type.
The Count
The count was one of the “core 2” variables I chose to analyze when I began this project along with attack zone, as it plays a crucial part in what we want to quantify.
Every pitch influences an at bat in either a positive or negative way; that goes without saying. That magnitude of that influence is heavily dependent on the current count, however. A strike is a strike in the box score, always, but a strike in a 0-0 count and a strike in a 0-2 count are not created equal in terms of net wOBA. Here are the wOBA’s on all counts in 2019:
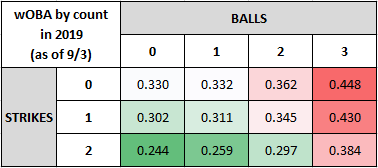
So the difference between an 0-1 count and an 0-2 count is -0.058 wOBA for the pitcher while the difference between 2-2 count and a 3-2 count is +0.087 wOBA for the pitcher. A strike in a 2-strike count is recognizably huge (final wOBA drops to 0.000) just like a ball in a 3-ball count is huge (wOBA = 0.69). All of these net wOBA’s can be converted into run totals and accumulated, which is the basis on which LRP is designed.
The Attack Zones
In this project, the attack zones are the tool that is used to determine what the chances of those advancements are. For the purposes of example, I’m going to isolate a fastball in a 1-0 count.
We see from the pitch count wOBA expectancy chart above that a 1-0 count has a wOBA of 0.332. A strike moves the needle to 0.311 (- 0.021 wOBA) and a ball moves it to 0.362 (+ 0.030 wOBA). The chances of a strike or a ball or a ball hit into play are determined by the Attack Zone.
Here are the % chances of each of those outcomes (for fastballs) by each attack zone, including wOBA on contact:


