

I’ve made some changes to the pCRA formula based on a few things, including how it has been doing this year compared to some of its peers like xFIP and SIERA. If you read the initial piece (found above), I compared the root mean squared error (RMSE) of pCRA to next season’s ERA to both xFIP and SIERA (along with ERA and FIP) and it more or less beat both – by a little bit with 40-80 IP totals in back-to-back years and by a greater amount with 120+ IP totals in back-to-back years.
This season, pCRA (before now) wasn’t doing as well as it did prior to this year. My hypothesis is that the model (which uses a player’s barrel rate allowed) wasn’t taking too kindly to the super juiced ball, and this was affecting things.
I’ve been meaning to make tweaks and improvements just based on certain things for a bit now, but this gave me a good reason to. Here are the changes that were made.
Additions:
- Under + topped batted balls “normalized”
- This little discovery started after a conversation with Mike Sutton (@ThatsABadTake) about “binning” certain types of pitchers into different groups (i.e. high-K, high-BB, low-BB, high-barrel, etc.) in order to find different strengths/weaknesses within each group, thus hopefully creating a stronger model. So I started out with a quick little correlation matrix, which ended up showing that topped/BBE and under/BBE, 2 Statcast batted ball classes, had a very strong negative correlation to it:
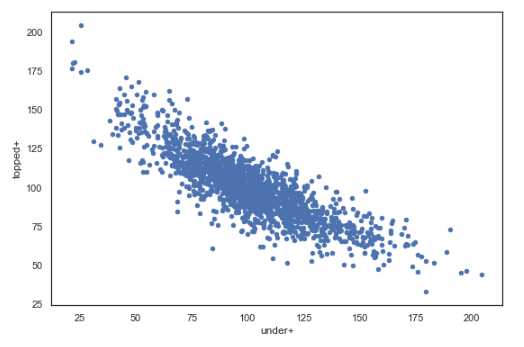
I was taken aback by this being such a strong relationship, so I shared on Twitter and Alex Chamberlain of RotoGraphs (@DolphHauldhagen) said he had noticed the same thing after looking at his pitch leaderboards for as long as he had. Seemingly, a pitcher’s topped/BBE rate and under/BBE rate have such a strong relationship because all pitcher’s (topped+under)/BBE rate – let’s call this TU/BBE – are roughly the same:
For all pitchers with 250+ BBE from 2015-2018, we can plot a histogram of each pitcher’s mark relative to league average, or TU/BBE+. As you can see, the average here hovers around 100, as expected, but the standard deviation (4.75) is incredibly small. This means that something like 70% of pitchers were within 5% of league average and something like 97% of pitchers were within 10% of league average. Pretty strong results.
- This mark is important because it makes up nearly 60% of all batted balls and the league average wOBA on these types since the beginning of 2015 is just 0.134. A pitcher with a mark much higher UT/BBE than league average will likely have a correspondingly low wOBA (and vice versa). This number, however, may be prone to regress, especially the extreme high and extreme lows, such as Zack Britton’s current 72.3% UT/BBE mark.
- More investigation needs to be done on my end to say whether a specific type of pitcher (i.e. high-ground-ball, high-fly-ball, etc.) is more likely to, or even can, “beat” this mark, but in the meantime, all pitchers will be credited with a 5-year rolling league average for UT/BBE rate, because my strong hypothesis is that pitchers cannot beat this mark by a notable amount of a long period of time.
- Ex: a pitcher with 65% UT/BBE will be credited with the 5-year league average of 58.7% UT/BBE.
- Results of barrels “normalized”
- There is some evidence that a pitcher’s barrel rate can be controlled to some degree. One thing that has not been shown to be repeatable is an ability to suppress damage on barrels allowed. A barrel is, after all, classified as such because it has an extremely xBA and xSLG. Such a small number of batted ball events such as barrels in a single year is a hard thing to analyze. However, not only is there barely correlation of a pitcher’s wOBA on barrels year over year, there has been a negative correlation between the two, if any.. As you increase the # of barrels over the course of multiple years, the range of resulting wOBA on them shrinks, leading me to believe pitchers shouldn’t deviate from league average results on barrels. All pitchers are credited with a 5-year rolling league average wOBA on their allowed barrels.
- Ex: a pitcher with a 1.600 wOBA on barrels allowed will be credited with the 5-year league average of 1.431 wOBA on barrels.
- There is some evidence that a pitcher’s barrel rate can be controlled to some degree. One thing that has not been shown to be repeatable is an ability to suppress damage on barrels allowed. A barrel is, after all, classified as such because it has an extremely xBA and xSLG. Such a small number of batted ball events such as barrels in a single year is a hard thing to analyze. However, not only is there barely correlation of a pitcher’s wOBA on barrels year over year, there has been a negative correlation between the two, if any.. As you increase the # of barrels over the course of multiple years, the range of resulting wOBA on them shrinks, leading me to believe pitchers shouldn’t deviate from league average results on barrels. All pitchers are credited with a 5-year rolling league average wOBA on their allowed barrels.
Improvements:
- Barrel rates “normalized” by 50%
- Again, there’s some evidence that shows that barrels/BBE for pitchers is a little bit of “skill”. It’s not as much of a skill as it is for hitters, but it seems to be more repeatable year over year than all other StatCast classifications.. That said, studies have shown that it is still a very volatile metric, even over a large amount of time, partially due to a pitcher’s inability to control exit velocities. Therefore, a pitcher’s barrel rate in the pCRA equation will be 50% his own and 50% a 5-year rolling barrel rate.
- Ex: a pitcher with 10% barrels/BBE will be credited with an 8.15% barrel rate after factoring in a 5-year league average of 6.3 barrels/BBE.
- Again, there’s some evidence that shows that barrels/BBE for pitchers is a little bit of “skill”. It’s not as much of a skill as it is for hitters, but it seems to be more repeatable year over year than all other StatCast classifications.. That said, studies have shown that it is still a very volatile metric, even over a large amount of time, partially due to a pitcher’s inability to control exit velocities. Therefore, a pitcher’s barrel rate in the pCRA equation will be 50% his own and 50% a 5-year rolling barrel rate.


